I'm quite new to DPARSF so I try to explain what I did so far as detailed as possible:
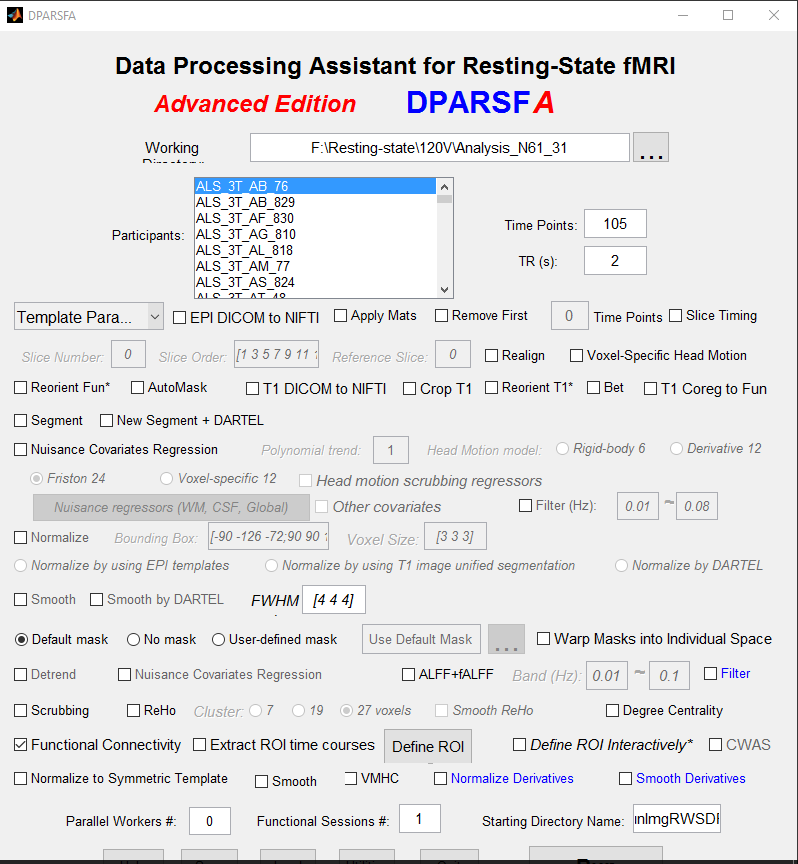
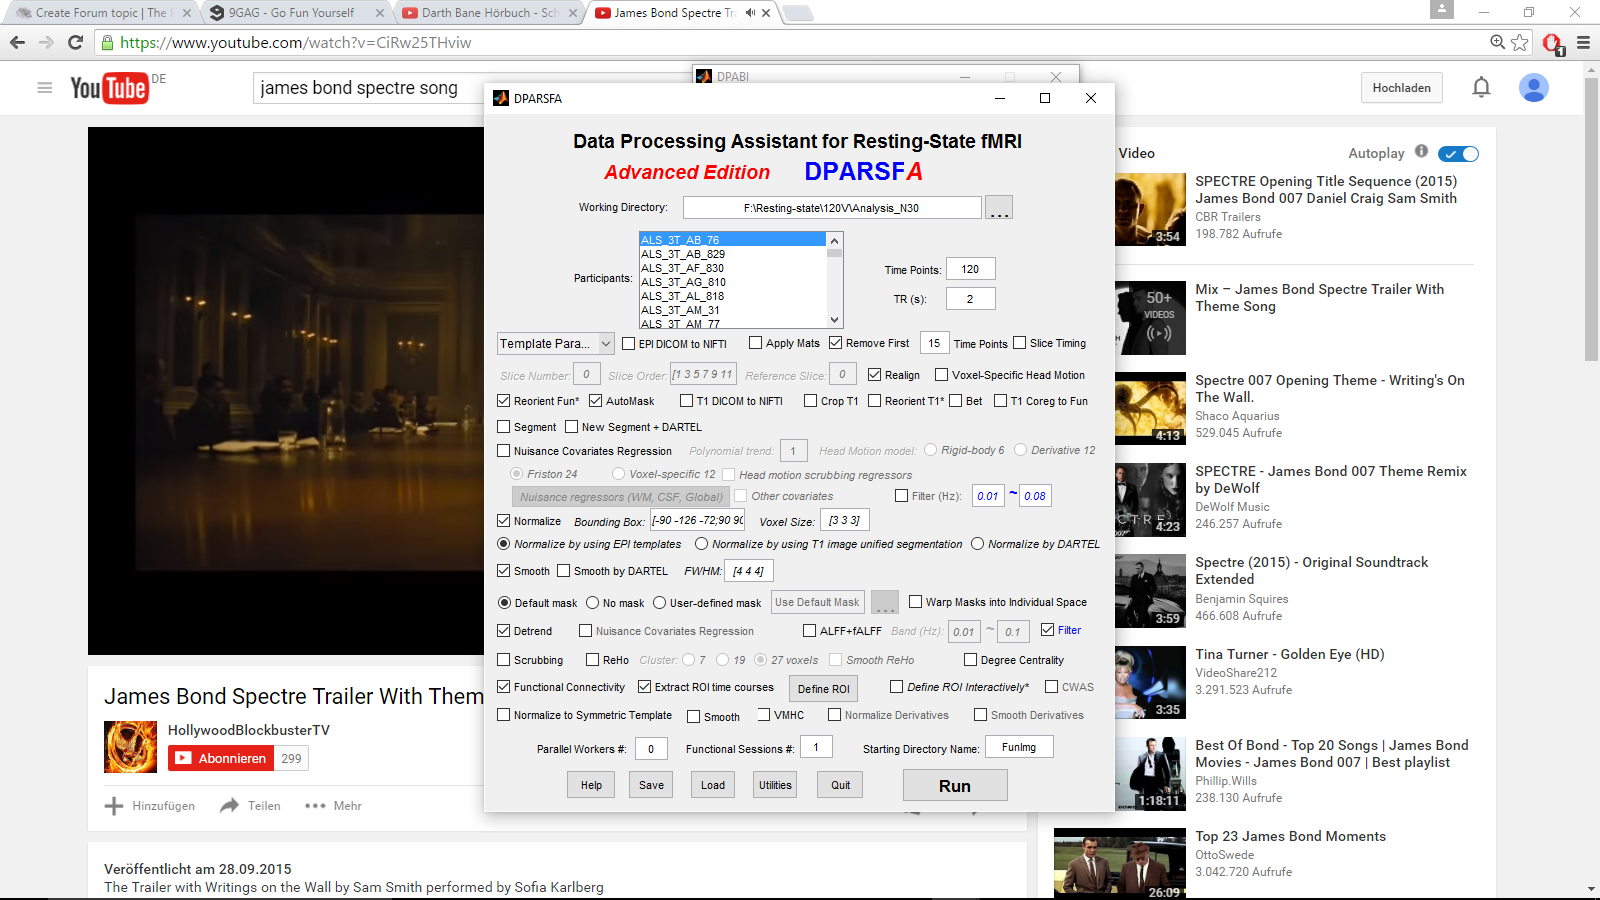
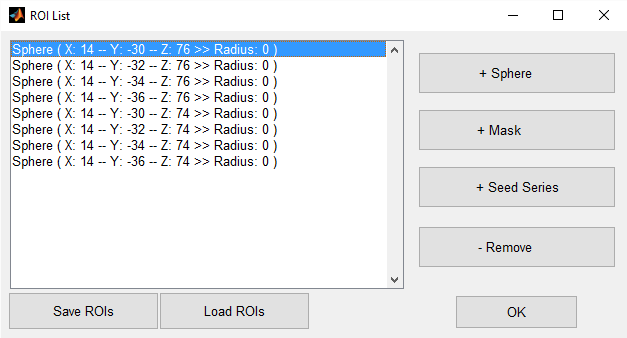
I am trying to do a Functional connectivity analysis with DPARSF of two groups: patients (N=57) and controls (N=33). I did the preprocessing using DPARSF (Which steps I chose can be seen on the picture, I uploaded: "DPARSF_preprocessing"). I included particular seed voxels into the Functional calculation, therefore I went under "Define ROI" --> "Sphere" and typed in the MNI-corrdinates of the voxels I am intereseted in (s. picture "Voxels_of_interest"). Is that a correct way of selecting seed-voxels in DPARSF?
However, after the first calculations were done, it turned out that the seed voxel I had chosen, wasn't a good one. So I did another run through DPARSF, but this time I only did calculations and no preprocessing (s. picture "DPARSF_postpreprocessing"). I set the starting directory name in DPARSF to FunImgRWSDF and did the FC-analysis as shown in the picture with these data. Is that a right way so far, to do another seed-voxel-analysis?
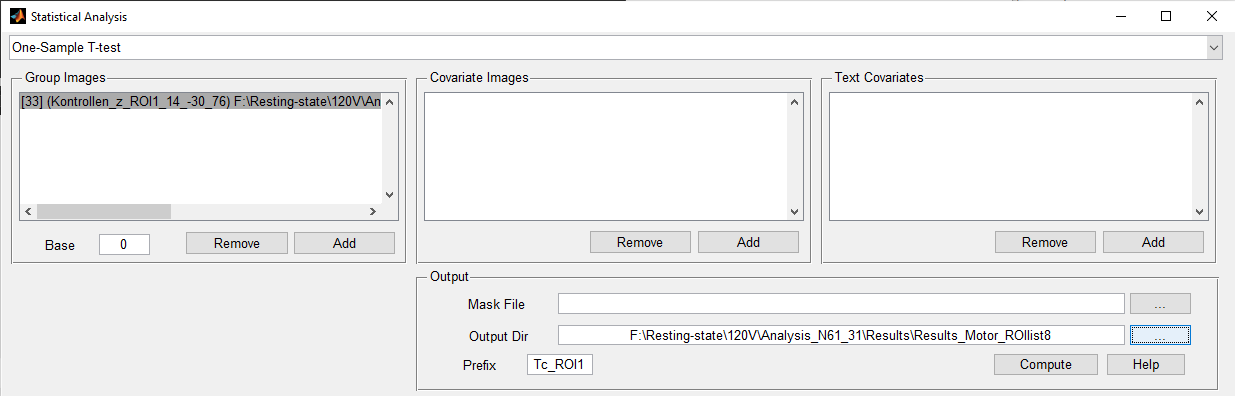
Now I have FC-maps and I calculate one-sample T-Tests on the basis of the zFCmaps. The settings I use for calculating it can be seen from the picture "Calculation_T1_controls". As can be seen I didn't add anything under "Mask file", is that necessary?
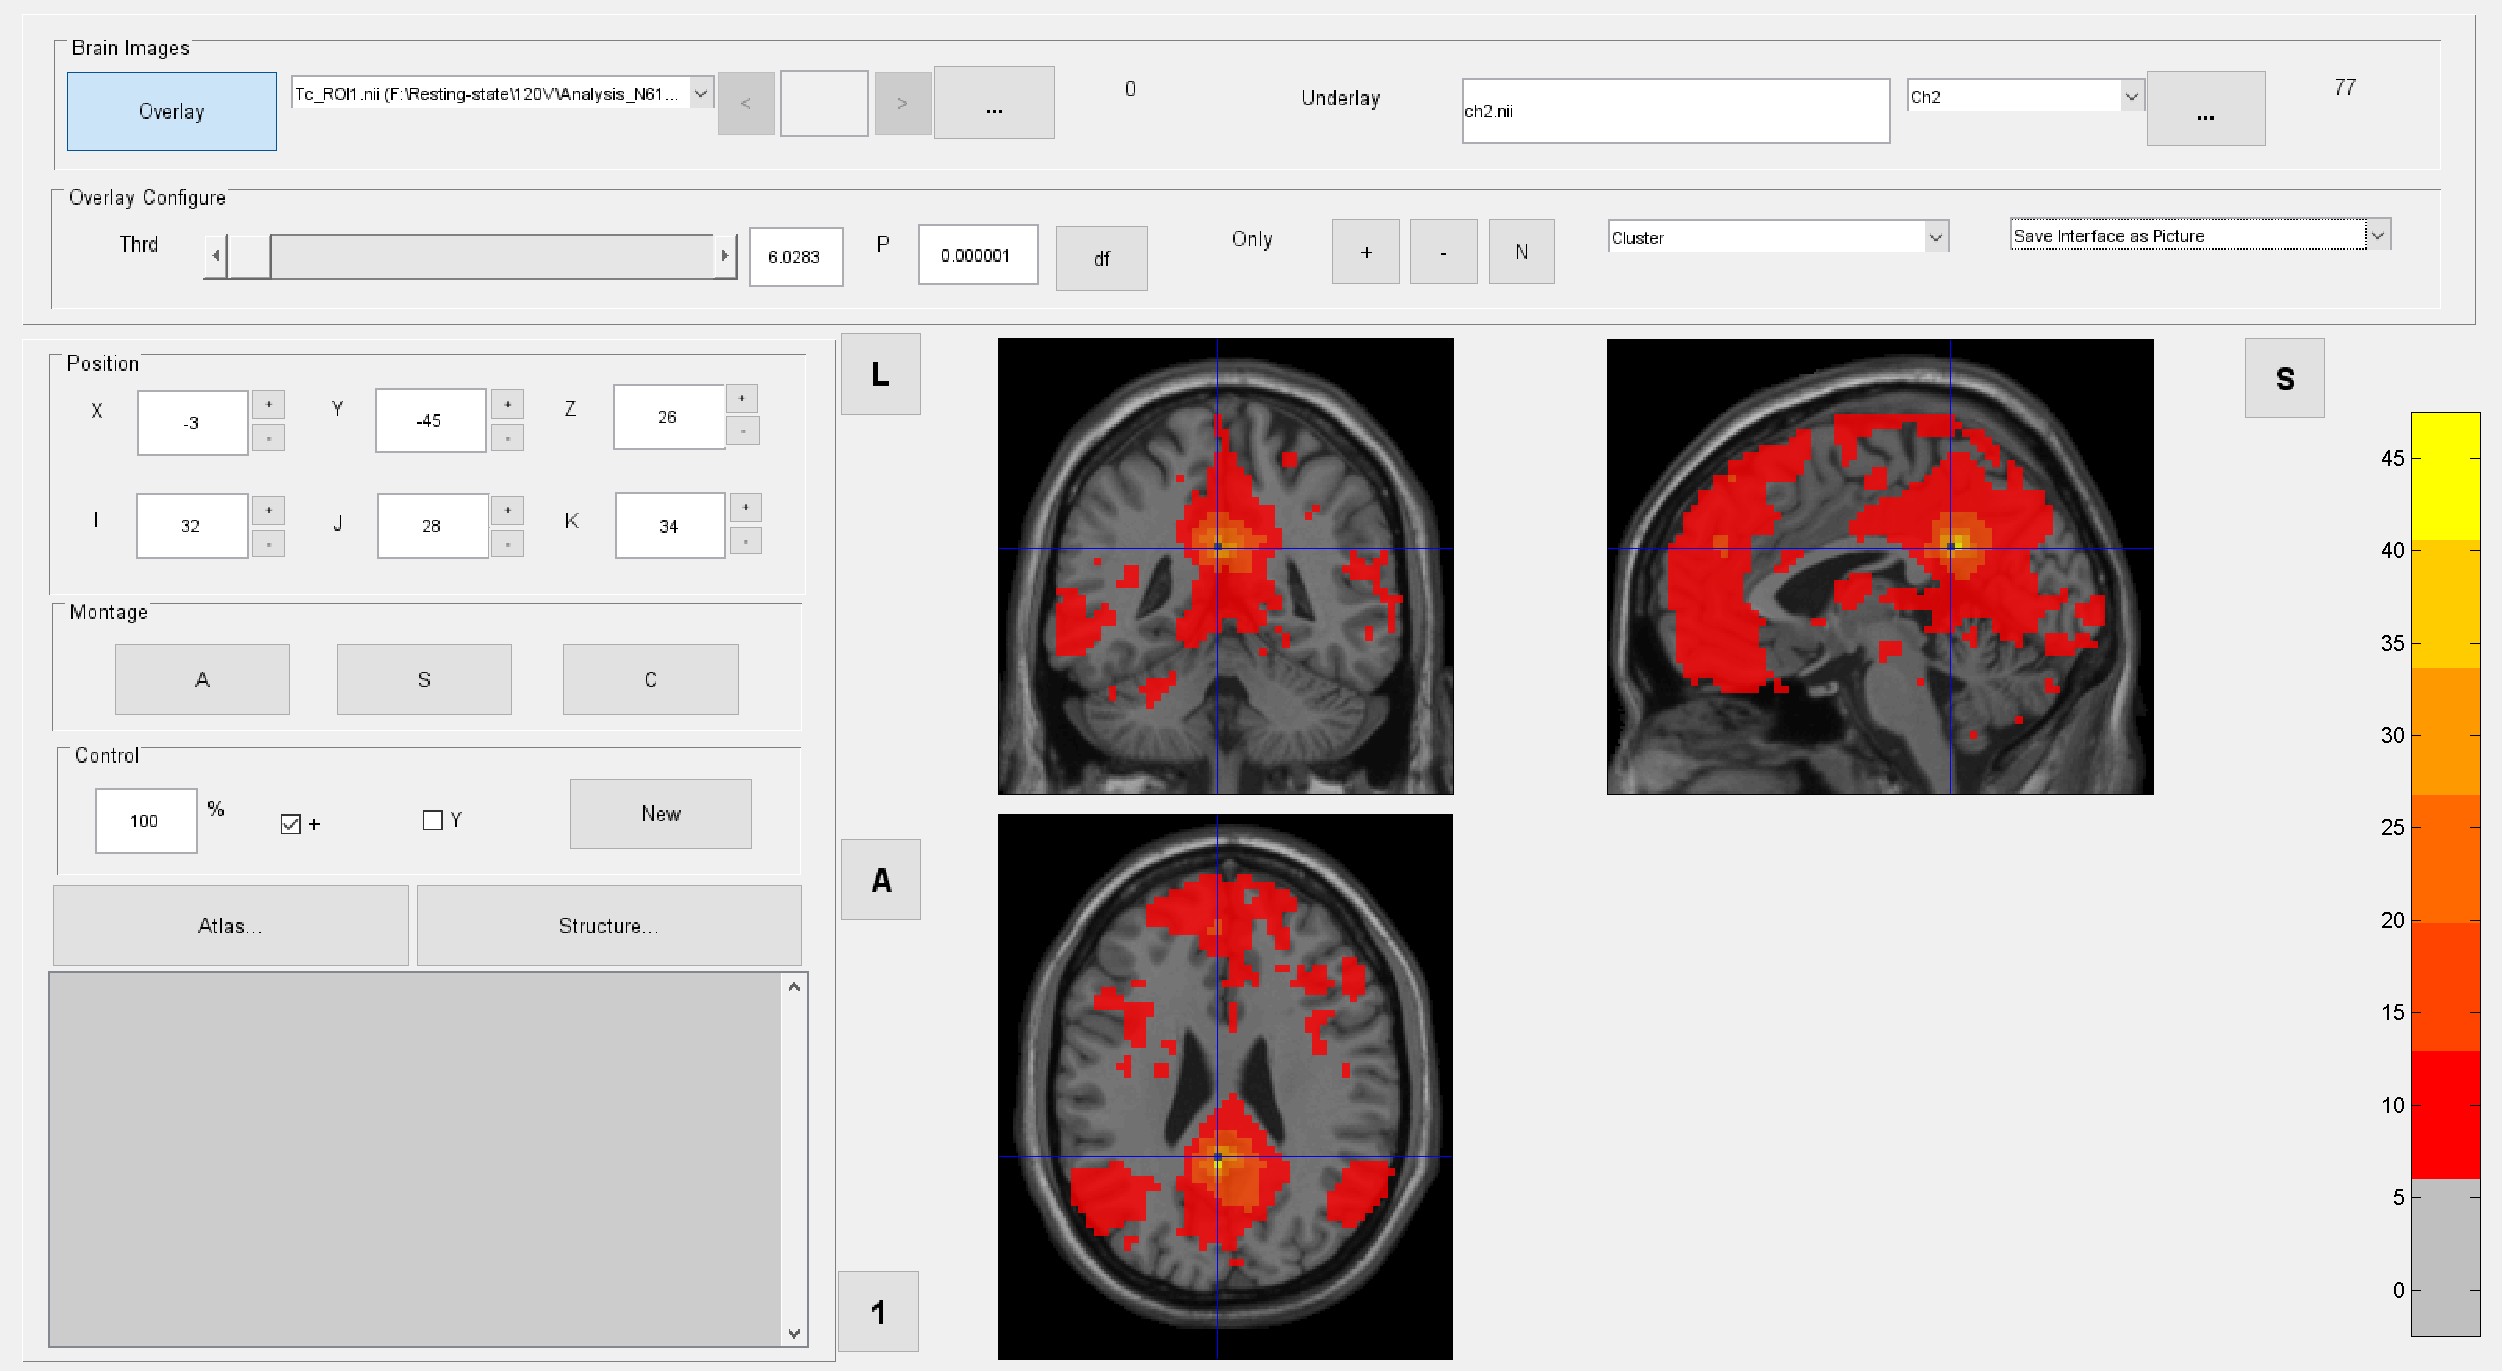
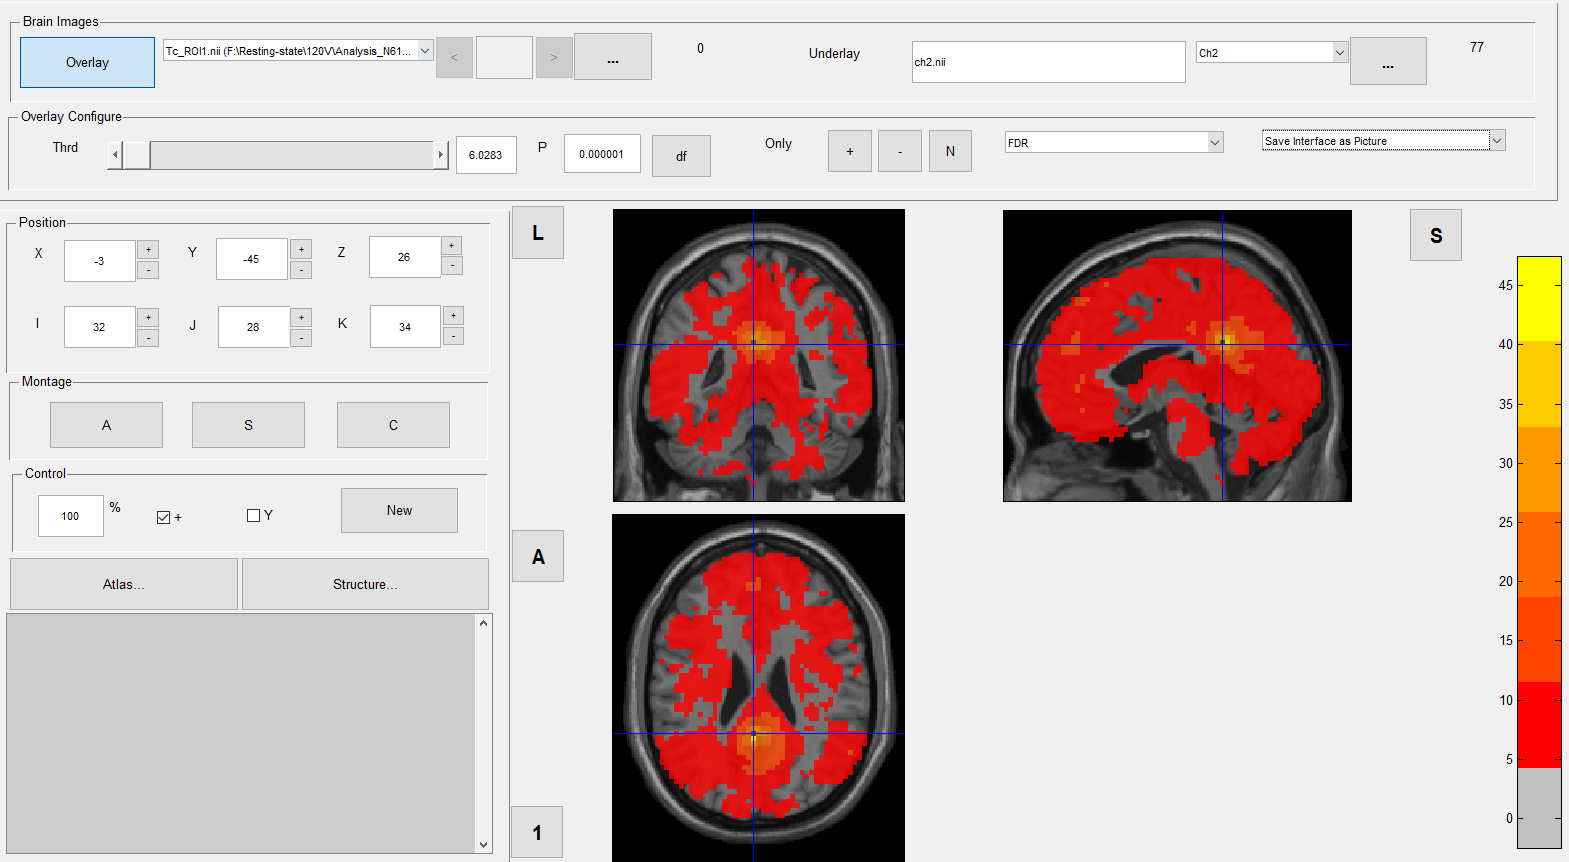
When I then view the results of this one-sample-T-test I am wondering which threshold to use. I was told in another part of this forum that p<0.000001 is recommended (s. piciture "Viewer_T1_controls_threshold_0.000001"). However I am wondering whether I still need to do an FDR-correction when using such a small p-value.
I want to compare my results to the results of another programm. And they use a different threshold for their one-sample-t-test: They use a threshold of p<0.001, FDR-corrected. I have tried to implement this in DPARSF, however, when I set the threshold of the one-sample-T-test to p=0.001 and then add FDR-correction with p<0.05, almost the whole brain "lights up" with significant voxels. Am I doing this wrong?
| Attachment | Size |
|---|---|
| This is the one-sample t-test for controls, filtered with a p of 0.000001 | 998.97 KB |
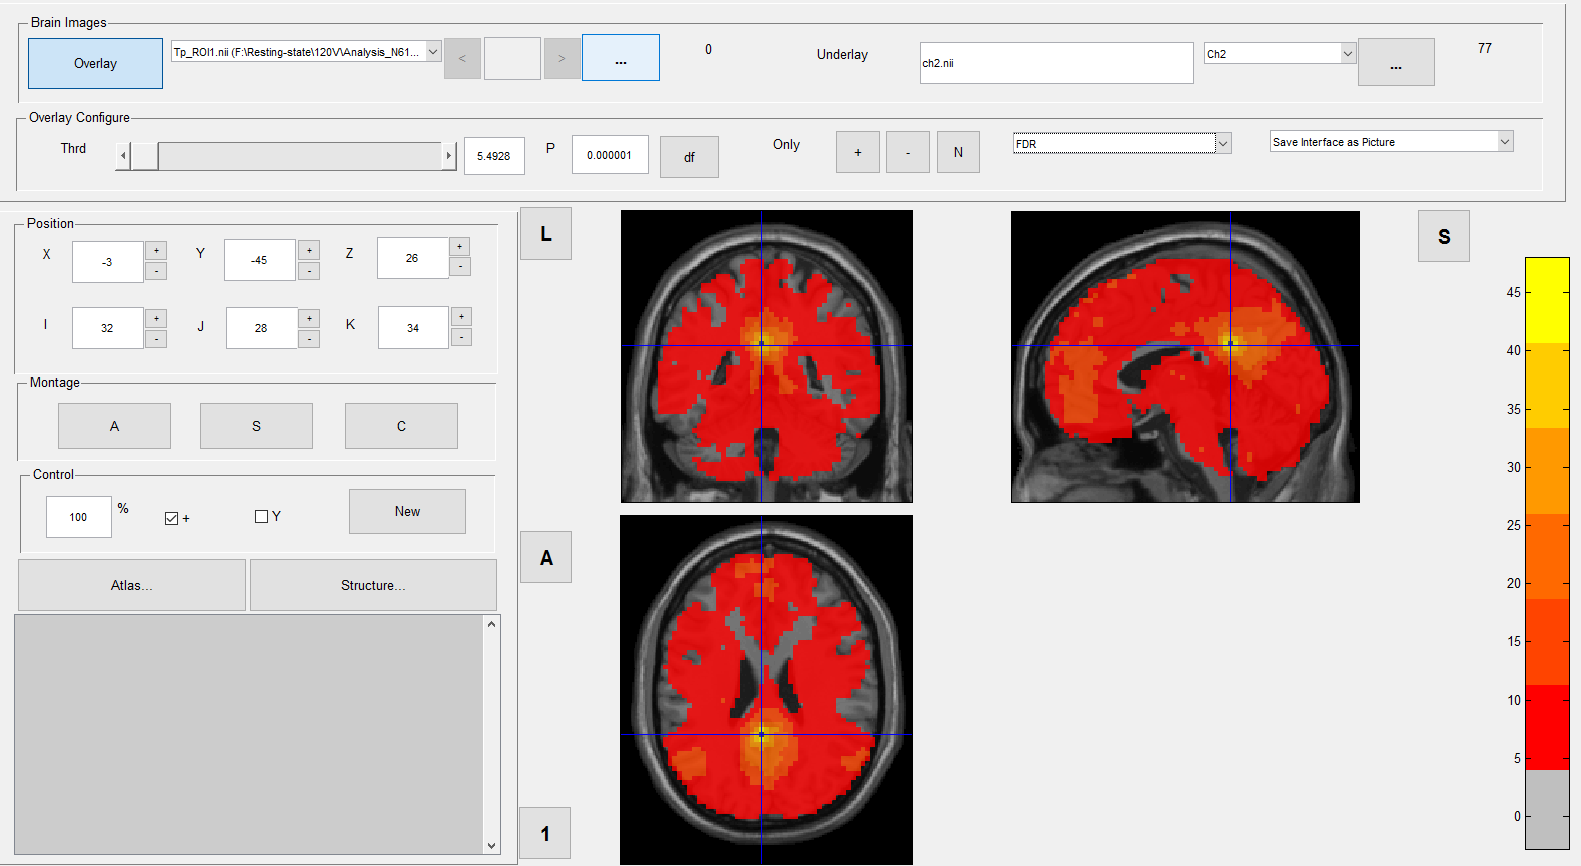
| This is the one-sample t-test for patients, filtered with FDR of q=0.001 | 277.19 KB |
| Viewer_T1_controls_Threshold_0.000001.png | 238.04 KB |
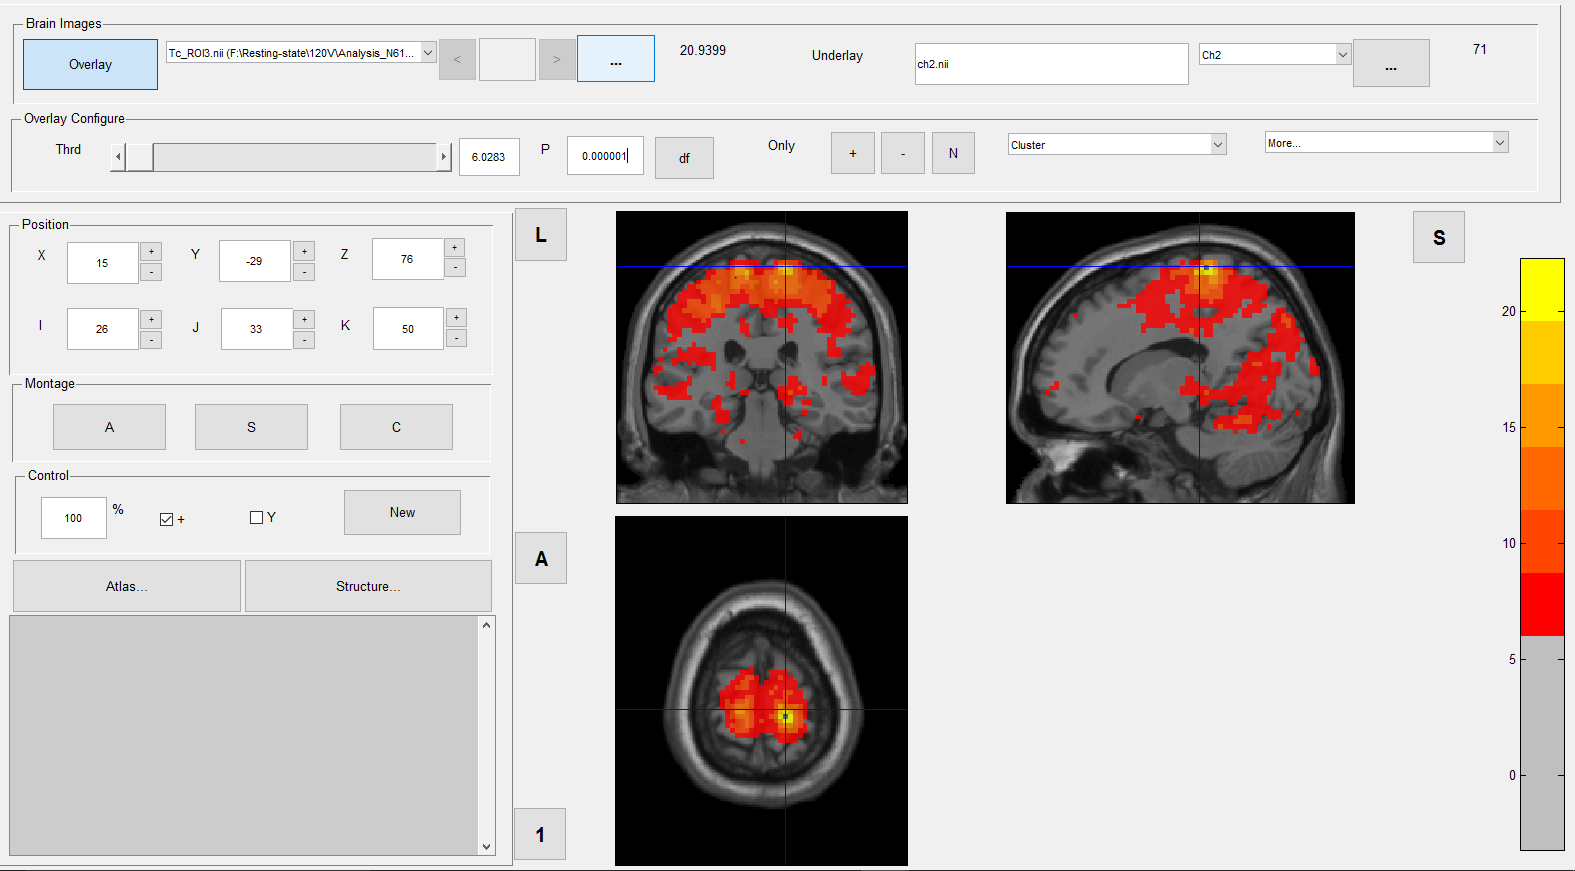
| This is the one-sample t-test for patients, filtered with a p of 0.000001 | 276.5 KB |
| DPARSF_postpreprocessing.png | 91.5 KB |
| Calculation_T1_controls.png | 26.57 KB |
| DPARSF_preprocessing.png | 535.83 KB |
| Voxels_of_interest.png | 17.24 KB |
| This is the one-sample t-test for controls, filtered with FDR of q=0.001 | 274.92 KB |
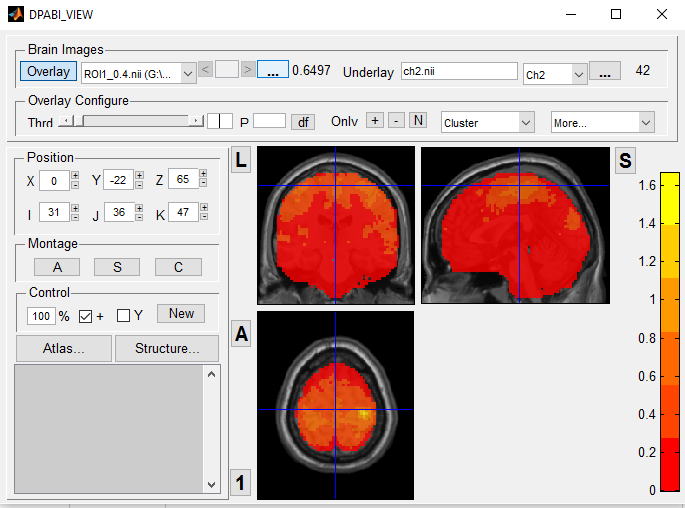
| Threshold_0.4.PNG | 84.21 KB |
1. In you settings, you
1. In you settings, you should perform "nuisance covariates regression". In addition, seems you skipped slice timing correction.
2. It's OK to do that. You could change the directory name "Results" to avoid confusion.
3. It's better to add a mask for the smoothness calculation (restrict within the mask).
4. FDR, GRF or AlphaSim correction, just choose one and stick on one.
5. As you didn't perform global signal regresion. It's common that all the brain lights up.
Best,
Chao-Gan
Mask generation for t-test
to 1) That is a good idea, yes, however, the programm that I am comparing my reults to, doesn't regress out any nuisance covariates and also does no slice timing correction.
3) I didn't quite understand your answer. What kind of mask would I then have to add to the t-test calculation. Is it the mask that can be generated under "quality control" --> "Generate Group mask"?
5) Ok, but the procedure that I did in order to copy the methods used in the other study was right? So first I set the threshold to p=0.001 and then just click on FDR-correction (I don't include a mask in FDR-correction and use a threshold of 0.05)? Or do I need to save the clusters on the threshold of 0.001 and then apply FDR-correction (with p=0.05) on that new image?
Thanks in advance,
Markus
Hi Markus,
Hi Markus,
1. If you want to compare, then that's fine.
2. "quality control" --> "Generate Group mask" is fine. Or you can use BrainMask_05_61x73x61.img
3. For FDR correction, you just need to set q=0.05 after correction. You don't need to set a voxel-level p value (0.001).
Best,
Chao-Gan
Threshold
Threshold
2) Which threshold should I use then for genrating the group mask? Should it be 90% ? Which threshold does the BrainMask_05_61x73x61 use
3) Ok, that makes sense. However, the authors of the program to which I am comparing my results did the following when anylyzing the one sample ttest. Quote: "The two sided one sample t test was thresholded at p < 0.001, corrected for multiple comparisons using the false discovery rate"
I understand this sentence in the way that I would set the p threshold to p < 0.001 and then do an FDR correction with q = 0.05 to this. Or am I understanding it wrong?
Thanks again
Hi,
Hi,
1. 90% is OK. BrainMask_05_61x73x61 is the SPM's a priori brain mask thresholded at 0.5.
2. I guess they set q=0.001.
Threshold of groupmask
1. I listened to what was said in the DPABI-Course-Video about generating a group mask. Let's say the group mask is thresholded at 0.5. Does that mean that 50% of the subject's brain have the same significant voxel? Or does this threshold set the value for minimum required correlation of the seed voxel with others to at least 0.5?
Thank you
Additional material
I loaded up a few more pictures in my inital post to help visualize the matter. The pictures show the one sample t-tests of either patients (N=57) or controls (N=33). They are besed on zFCmaps of a Seed-voxel for the Default-Mode-Network and differ only in the filter applied. One picture will show the one-sample-test for the network of either patients or controls, filtered with either a p=0.000001 or FDR=0.001.
The network quality appears to be much better when filtered with p=0.000001 but that is only true for the controls. In both patient pictures almost every voxel seems to be significant. This is however on the contrary to my colleagues results, who works with another program and who's network quality appears to be good in both groups. However, he filters the individual correaltion scores of the FCmaps with a threshold of 0.4, meaning that the t-test will only include correlations above 0.4.
So I am wondering whether this can be done as well in DPARSF. I've tried to do the one-sample-t-test with the additional mask (the template from DPAII with threshold of 0.5 and a generated group mask of 40%) but it has not changed the results.
Hi,
Hi,
I don't quite understand why you need first threshold at r>0.4 and then forward to one-sample t-test.
If you really want to do this, you can use:
DPABI->Utilities->Image Calculator
with the following expression:
g1.*(g1>0.4)
Best,
Chao-Gan
Arithmetical average of z-scores
Hi,
thanks for the formula!
yeah, i think I understood that wrong myself. I think they do a threshold of >0.4 on the zFCmaps and then don't calculate a one-sample-t-test but just form a arithmetically average of the respective group's zFCmaps. So my question, is it possible, perhaps with the image-calculator, to just form an arithmetical group average image of the zFCmaps of a group instead of doing a one-sample-t-test?
With kind regards
Markus
Hi Markus,
Hi Markus,
Simply input
mean(g1)
Best,
Chao-Gan
Study-specific EPI template
Thank you very much :-)
Another question: Is DPARSF able to generate a study-specific EPI-template for Normalization?
Best
Markus
Hi Markus,
Hi Markus,
In DARTEL, a group specific template (gray matter and white matter) would be used. This needs you have the T1 images.
Best,
Chao-Gan
EPI-template or T1-template
Ah ok, but is that a normalization which results in an study-specific EPI-template or does it then produce a T1-template?
Best
Markus
Additional question
Dear Chao-Gan,
I have another question, not related to the EPI-template but to the matter which I stressed before. I have tried to calculate the mean of the zFC-maps with the image-calculater and the formula: mean(g1). It worked, however now DPARSF won't view the final result. I always get the following error:
Hi Markus,
Hi Markus,
1. Study specific EPI template is not generated or used in DARTEL.
2. I guess there are infinite values in your image. You can revise the mean image:
[Data Head]=y_Read('XXX.nii');
Data(find(isnan(Data)))=0;
Data(find(isinf(Data)))=0;
y_Write(Data,Head,'XXXNew.nii');
And see what DPABI_VIEW displays.
Best,
Chao-Gan
Solution
Dear Chao-Gan,
Thank you very much. This worked and I was able to view the image properly. However I now have the problem of setting a proper threshold. I created an arithmetically averaged group image of individual zFCmaps, which had been thresholded at z(r) < 0.4 before. However, when I open the group image now it still shows the z(r)-values from 0 to 1.6. At least that's the range displayed at the colorbar on the right side. Do you know why this happens? Shouldn't it just show the values from z(r)<0.4? Perhaps I interpret it wrong and the colorboar does not represent the z(r)-values? I've attached a picutre "threshold_0.4" at my former comment, whicih displays the group image.
Best,
Markus
Hi Markus,
Hi Markus,
For a given voxel, some subjects have values higher than 0.4, and some subjects have values of 0. You will get a mean < 0.4.
Best,
Chao-Gan
0.4
Dear Chao-Gan
Ah ok, so if I set the threshold to 0.4 then I should be able to see whose values are <0.4?
Best
Markus
For a voxel, open each
For a voxel, open each subject's map and see which one is 0 after thresholding.
Group-Image
Ok. But when i open up the group image, then I should also set the threshold to 0.4 is that right?
I guess so, though I didn't
I guess so, though I didn't get your rationale for threshold first and average and threshold again.